Introduction
Windows shows clear signs when memory runs tight: apps freeze, tabs reload, and the disk light stays lit as the system swaps. You can spot issues early and fix them by watching the right numbers. This guide explains how to monitor memory usage in Windows with built-in tools and a few power-user utilities. You will learn what the terms mean and how to read them fast. You will also log trends, set alerts, and diagnose leaks. We start with the basics, then move through Task Manager and Resource Monitor. Next, you will build long-running views with Performance Monitor and simple scripts. Along the way, you will see when to act, what to ignore, and how to decide if a RAM upgrade makes sense.

Understand Windows Memory Basics: RAM, Virtual Memory, Commit, and Cache
RAM vs Virtual Memory vs Commit Charge
RAM stores active data. Virtual memory extends it with disk-backed pages. Windows maps each process address space into virtual memory and backs it with RAM or the page file. Commit charge is the total virtual memory promised to processes. If commit grows near the commit limit (RAM plus page file), the system feels pressure. Watch commit for trends, not just spikes. Healthy systems keep commit well below the limit during normal work. When commit moves up during a workload and then falls after apps close, the system behaves as expected. If it only climbs and never drops, plan deeper checks.
Working Set, Private Bytes, and Shared/Cached Memory
Working set is the RAM a process actively touches. Private bytes are memory only that process can use; they drive commit and often reveal leaks. Shared memory, like DLLs, appears in many processes but loads into RAM once. The cache, also called the standby list, holds file and code data for speed. Windows reclaims it when apps need memory. High cache alone rarely signals a problem. It often helps performance. Use private bytes to judge real growth and use working set to see short-term pressure.
Paged and Nonpaged Pools Explained
Kernel-mode memory lives in two pools. Paged pool can page to disk. Nonpaged pool must stay in RAM. Drivers and core components allocate from these pools. Nonpaged pool growth can starve the system and often indicates a driver bug or leak. Watch both pools and their tags if you suspect kernel memory problems. With these terms clear, you are ready to read Task Manager and spot early warning signs. Next you will take a quick pulse and find top consumers.
Check Memory Usage Quickly with Task Manager (Windows 11/10)
Open Task Manager and Read the Performance > Memory Tab
Open Task Manager fast:
1) Press Ctrl + Shift + Esc.
2) Click Performance, then Memory.
3) Note In use, Available, Committed, Cached, Paged pool, and Non-paged pool.
The Memory graph shows pressure trends by second. Hover to see composition, speed, form factor, and slots used. If Committed approaches the limit or Available stays very low for minutes under load, you need deeper inspection. This view gives a system-wide pulse before you drill into processes.
Find Top Memory Consumers in Processes and Startup
Use Processes to spot heavy apps:
– Click Processes and sort by Memory.
– Expand apps to see child processes, such as browser tabs.
– Right-click columns > Select columns > enable ‘Commit size’ and ‘Power usage’.
To cut baseline load, open Startup and disable non-essential items. Reboot and measure again. A clean startup sequence reduces idle memory and noise in your data. If one app keeps rising over time, plan a long-run capture next. That leads you to Resource Monitor for process-level detail.
Interpret In Use, Available, Committed, Cached, and Pools
In use’ is physical RAM actively used. ‘Available’ equals free plus standby (cache that Windows can reclaim). ‘Committed’ shows virtual memory promised to processes; ‘X/Y’ means used vs limit. ‘Cached’ speeds file access and is healthy. Paged and non-paged pools reflect kernel allocations. Consistent low Available with a growing Committed usually signals pressure. The next step is to confirm which processes cause it with Resource Monitor.
Drill Down with Resource Monitor for Process-Level Detail
Working Set vs Private vs Shareable Memory
Launch Resource Monitor by typing resmon in Start. Open the Memory tab. Add columns: Commit, Working Set, Shareable, and Private. Working Set shows active RAM. Private indicates per-process memory that drives commit. Compare Private growth over time to spot leaks. Shareable often includes DLLs and caches that do not uniquely load for each process. This split helps you separate true growth from normal shared memory behavior. After you find the suspects here, you will track them over time.
Spot Hard Faults/sec and Standby List Pressure
Check Hard Faults/sec and the Physical Memory bar. Hard faults happen when a needed page must load from disk. Sustained faults slow apps and often coincide with disk spikes. A few bursts are normal; long runs show pressure. If most RAM sits in Standby while apps fault, clearing cache will not solve the root cause. You may need more RAM or to close memory-heavy apps. Note the offenders before you move to long-term logging in Performance Monitor.
Filter by Process, Service, and Associated Handles
Use the Filter in Resource Monitor to select a process. Below, see related modules and handles. These views hint at what maps into memory. Services hosted in svchost.exe can hide usage; right-click and choose ‘Go to Service(s)’ to identify them. If a service-linked process grows, note its name and role. Now you have suspects to track in Performance Monitor with targeted counters and scheduled logs. That is where trends tell the full story.
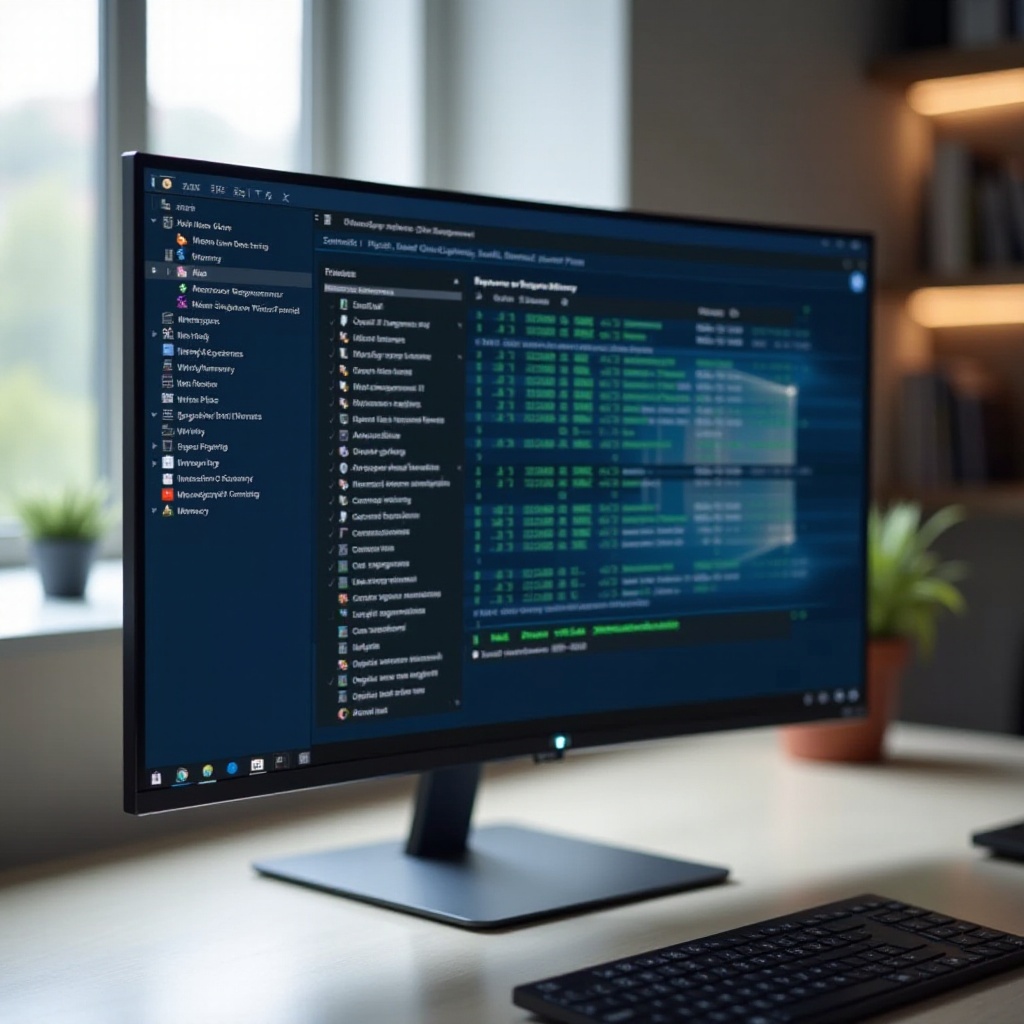
Track Trends with Performance Monitor (PerfMon) for Long-Running Visibility
Must-Have Counters for System and Apps
Open perfmon and add counters:
– Memory: Available MBytes, Committed Bytes, Cache Bytes, Pool Nonpaged Bytes.
– Paging File: % Usage.
– Process (per suspect): Private Bytes, Working Set, Handle Count, Thread Count.
– LogicalDisk: Avg. Disk sec/Read and Write to correlate stalls.
Sample every 5 to 15 seconds. These counters reveal growth, pressure, and disk impact. Choose a conservative interval to reduce overhead while keeping useful resolution for trend analysis. With the right counters picked, set up Data Collector Sets.
Create Data Collector Sets and Schedule Logs
In Data Collector Sets > User Defined, create a new set for counters. Choose CSV for easy parsing. Set a root path, name files by computer and date, and set a stop condition by duration or size. Use Task Scheduler to start at logon or on a trigger. Rotate logs weekly and archive to a separate disk. Label sets by purpose, such as ‘Browser Leak’ or ‘VM Build’, to match data to tests. After logging, you will compare behavior to a healthy baseline.
Analyze Charts, Reports, and Baseline Trends
Open Reports > User Defined to view charts. Focus on Private Bytes and Committed Bytes over time. Look for steady, unbounded growth rather than saw-tooth patterns. Compare to a baseline from a healthy session. Correlate memory growth with disk latency and hard faults. If only one process grows, dig into that app. If pools grow, look at drivers. With a trend confirmed, you can move to automation and lightweight scripting for continuous monitoring.

Monitor via PowerShell and Command Line
One-Liners for Snapshots and Top-N Processes
| – Get-Process | Sort WorkingSet -desc | Select -First 10 Name, WorkingSet |
| – Get-Process | Select Name, PM, NPM, WS, CPU | Export-Csv .\mem.csv -NoTypeInformation |
Stream Counters and Trigger Threshold Alerts
Stream counters continuously:
– Get-Counter ‘\Process(app)\Private Bytes’ -Continuous -SampleInterval 5
Use simple thresholds. If Available MBytes stays low for more than a minute, log an event and send an alert. Combine with Scheduled Tasks to start monitoring at logon. Keep sample intervals modest to avoid overhead. This gives near real-time alerts without leaving Performance Monitor open.
Export to CSV/JSON and Visualize Results
| – Get-Counter … | Export-Csv .\perf.csv | |
| – Get-Process … | ConvertTo-Json | Out-File .\proc.json |
Advanced Tools for Deep Diagnostics
RAMMap: Physical Memory Breakdown and Standby Lists
Download RAMMap from Microsoft Sysinternals. It breaks down physical memory by usage type: file cache, drivers, heap, and more. Use the File Summary and Use Counts tabs to find which files occupy cache and how much. The Standby list view shows cached pages by priority. If standby dominates and apps fault, more RAM helps. If driver-locked pages dominate, investigate those drivers. RAMMap gives you insight you cannot see in simple counters.
VMMap: Per-Process Virtual Memory Maps
VMMap analyzes one process virtual address space. It shows heaps, stacks, images, and private data. Track how Private Data grows while the working set spikes and falls. Compare snapshots over time to confirm unbounded growth. Combine VMMap with the process Private Bytes counter in PerfMon for a complete picture. If a specific heap or allocation type grows, collect app logs and reach out to the vendor with evidence.
PoolMon: Kernel Pool Leak Hunting
PoolMon tracks kernel pool allocations by tag. Run it in an elevated Command Prompt and watch tags with rising bytes and allocations. Match suspicious tags to drivers using tag references or Driver Verifier. If nonpaged pool grows without bound, you likely have a driver leak. Update, roll back, or disable the driver to confirm. When PoolMon points to a culprit, you can move to remediation with confidence. With deep diagnostics done, you can now focus on structured troubleshooting steps.
Detect and Troubleshoot Memory Leaks
Identify Leak Patterns in Private Bytes and Working Set
A leak often shows as steady Private Bytes growth in a process, even when idle. Working set may oscillate, but Private Bytes keeps rising. Validate with PerfMon logs over hours or days. Capture a baseline, then run the same workload again. If growth resumes from a clean start, you likely have a leak. Record versions and timestamps before testing fixes to confirm the change impact.
Correlate Spikes with Event Viewer and Reliability Monitor
Open Event Viewer and filter Application and System logs for warnings and errors during growth. Use Reliability Monitor to spot crashes or hangs that align with memory peaks. Note driver and app updates near the first incident. If a memory spike aligns with a task, scheduled scan, or browser session, reproduce it. This correlation narrows suspects before you change drivers or software. After you pinpoint likely causes, apply fixes in a controlled order.
Apply Fixes: Updates, Rollbacks, Isolation, and Reinstalls
Fix leaks with a staged plan:
1) Update the app or driver to the latest stable build.
2) If the issue started after an update, roll back to the prior version.
3) Disable add-ons and extensions; retest.
4) Run clean boot to isolate third-party services.
5) Reinstall or repair the app.
6) If a driver leaks, replace it with a vendor or Microsoft-provided version.
Confirm with the same PerfMon data set and workload. Once you stabilize the system, add automation so you catch regressions early.
Alerts, Automation, and Remote Monitoring
PerfMon Alerts with Task Scheduler Actions
Create an alert in Performance Monitor:
– Choose a counter, such as Available MBytes or Process\Private Bytes.
– Set a threshold and sample interval.
– Choose an action: run a script, write to the event log, or start a program.
Schedule the alert with Task Scheduler to start at boot. Test by forcing load and confirm the action fired. Proper alerts shrink time to detection and reduce guesswork during incidents. If you support multiple PCs, extend monitoring over the network.
Lightweight Scripts, WinRM, and Remote Sessions
For fleets, run monitoring scripts remotely over WinRM:
– Invoke-Command -ComputerName PC1,PC2 -FilePath .\mem.ps1
– Enter-PSSession for ad-hoc checks.
Keep scripts light: limit counters, sample less often, and write small logs. Store data centrally over SMB or use a pull-based system. If endpoints run on battery, reduce frequency to save power. Remote monitoring scales your workflow without heavy agents. With data flowing in, you can build simple weekly dashboards.
Weekly Dashboards and Capacity Planning
Turn logs into a weekly dashboard:
– Peak commit vs limit.
– Top processes by Private Bytes growth.
– Average Available MBytes during workloads.
– Hard faults and disk latency peaks.
Set targets and track variance. If typical workloads push commit near the limit, plan a RAM upgrade. If one team app grows, coordinate fixes. Dashboards keep performance visible and make budget requests evidence-based. With best practices in place, you avoid common traps that waste time.
Best Practices and Common Pitfalls
When High Cache Is Normal and Beneficial
Windows uses free RAM to cache files and code. That cache speeds launches and reduces disk I/O. When apps need memory, Windows reclaims cache quickly. High ‘Cached’ or a small ‘Free’ number alone does not mean a problem. Judge by sustained low Available, high commit pressure, and hard faults plus slowdown. Avoid ‘cache clearing’ tools; they often hurt performance and hide real issues.
Page File Strategy and SSD Considerations
Keep a page file unless you have a specific reason not to. System-managed sizing suits most PCs and adapts to peaks. On SSDs, paging is faster and safe for wear life in normal use. If you handle large dumps, ensure free disk space and a page file big enough to capture memory dumps for crash diagnosis. After changes, verify with commit and paging file usage trends. A balanced page file prevents sudden out-of-memory conditions.
Drivers, Malware, and Background Apps Impact
Bad drivers and malware can chew RAM and pools. Keep Windows, drivers, and security tools current. Remove bloatware and limit startup apps. Run a full scan if memory rises without a clear cause. Watch security tools during scans; high usage may be normal and temporary. If a vendor tool stays heavy long after a scan ends, review settings or replace it. Always validate fixes with fresh logs. If pressure remains after tuning, evaluate hardware capacity.
When to Upgrade RAM and Validate the Results
Symptoms You Have Outgrown Your Memory
Upgrade when:
– Committed bytes push near the limit during normal work.
– Available MBytes stays low with sustained hard faults and disk latency.
– Critical apps slow or crash under load even after tuning.
If logs show repeated pressure across weeks and you have trimmed background apps, more RAM will likely improve stability and speed. Use your baseline to estimate how much headroom to add. Plan an upgrade window and document before-and-after metrics.
Choose Compatible DIMMs and Dual-Channel Configs
Match speed, voltage, and type to your motherboard. For best throughput, populate matched pairs for dual-channel. Check the qualified vendor list and firmware updates. If all slots are used, consider replacing with higher-capacity sticks rather than mixing kits. Before purchase, confirm maximum supported capacity. After installation, verify the system sees the full capacity in Task Manager and in BIOS.
Post-Upgrade Stability and Performance Checks
Run the same PerfMon set you used before the upgrade. Compare peak commit, available memory under load, and hard faults. Launch your heaviest workflows and watch for smoothness. Run a memory test if you see instability. If performance still lags, look at CPU and disk bottlenecks. A clean before-and-after log closes the loop and proves the upgrade value. With capacity confirmed, you can scale workloads with confidence.
Conclusion
You can keep Windows fast and stable by watching memory the right way. Start with Task Manager for quick checks. Use Resource Monitor to confirm process-level facts. Log long sessions with Performance Monitor and small PowerShell scripts. When needed, reach for RAMMap, VMMap, and PoolMon to find deep causes. Set alerts and build simple dashboards so issues surface early. Validate every change with repeatable tests and logs. If capacity remains tight, plan a RAM upgrade with confidence.
Frequently Asked Questions
Is high memory usage always bad in Windows?
Not always. Windows caches files and code to speed launches, so cached memory can be high without harm. Watch symptoms and numbers together. If available memory stays very low, hard faults remain high, and apps lag, you have pressure. If the system stays responsive and faults remain low, high usage likely reflects healthy caching. Use trends and baselines to judge.
What is the difference between Working Set and Private Bytes?
Working Set is the RAM a process actively touches right now; it can rise and fall as Windows trims or expands it. Private Bytes is memory reserved only for that process and contributes to the system commit. Leaks usually show as steady growth in Private Bytes, even if the Working Set oscillates. Track both to see real growth versus short-term changes.
How can I monitor memory continuously without slowing down my PC?
Keep monitoring light. Sample a small set of counters, like Available MBytes, Committed Bytes, and a few Private Bytes, every 10–30 seconds. Log to CSV, not to heavy databases. Run scripts at logon with Task Scheduler. Use PerfMon alerts to trigger only when thresholds persist. Rotate logs weekly. Avoid very short intervals unless debugging.